


HOW OUR INDICATORS WORK
One of the most difficult steps in making an investment decision is after a big movement in the market, which is called the “moment of explosion”.
POWERFUL AND EASY TO USE INDICATORS
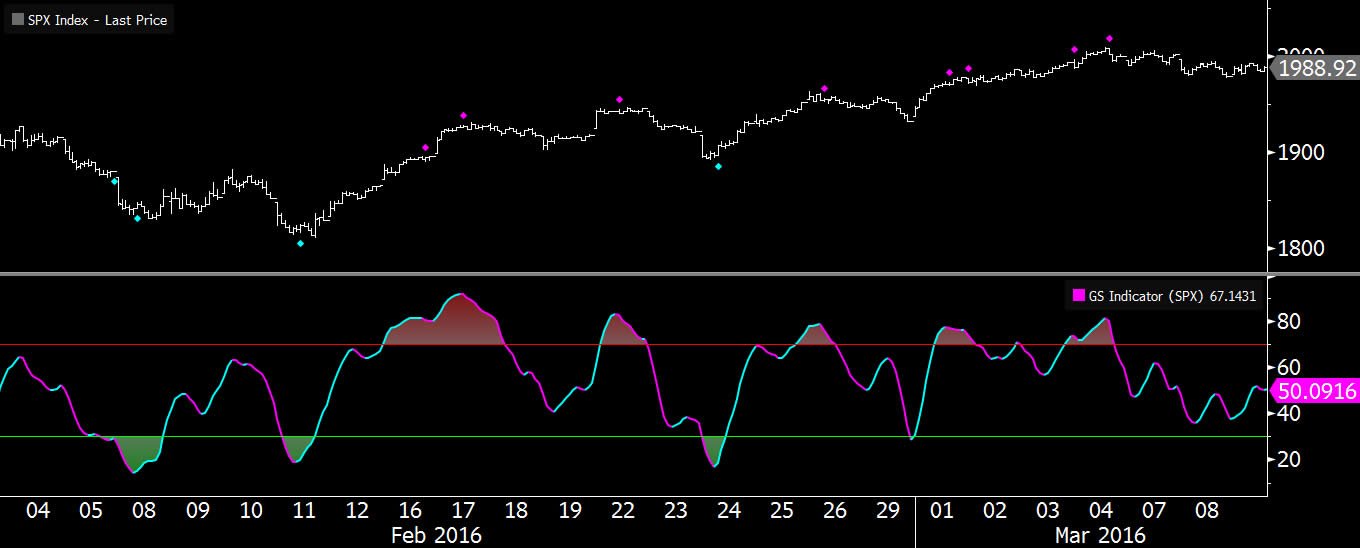
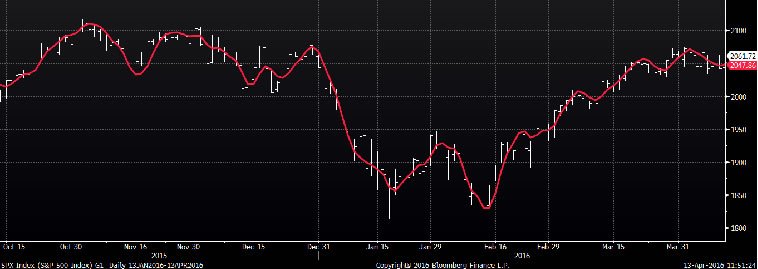
We currently have 11 indicators, which are based on our theory called (VERA) Volatility Explosion Relatively Adjusted designed to predict the moment in which the volatility explosion will occur and thus obtain a first warning signal that generates a new investment strategy.
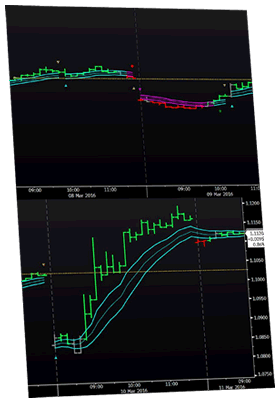
Color (Blue) bullish trend and Color (Magenta) bearish trend.
Vera Average: Market price of the reference area
Upper limit: upper band used as trailing stop for short positions
Lower limit: low band used as trailing stop for long positions
Red and green arrows – the entry point for long and short positions
Orange Triangles: ALERA VERA can be used in two ways:
- Profit-taking (usually overnight position)
- Volatility exposure alert where the stop or trailing stop must be established
Blue or magenta triangles: serve as a sign of re-entry into positions and/or confirmation of a trend
OHLC bars, Red (bearish), Green (bullish), Gray (Neutral)

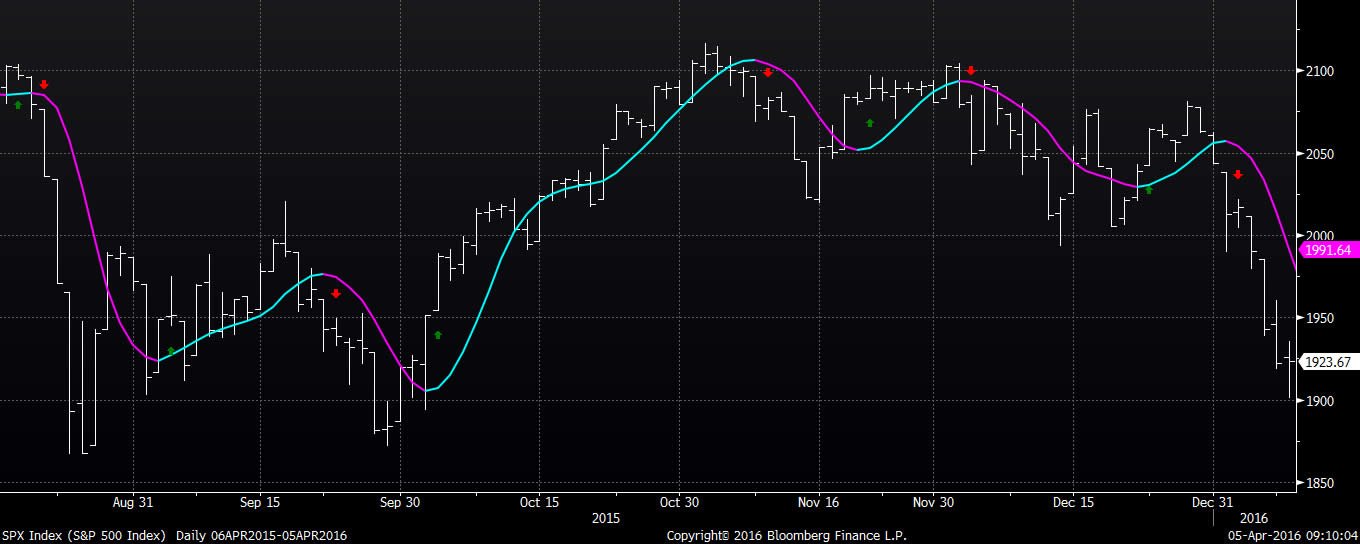
Line (blue): bullish stops area
Line (magenta): area of stops for a downtrend
Grayline (opening): entrance to the risk area
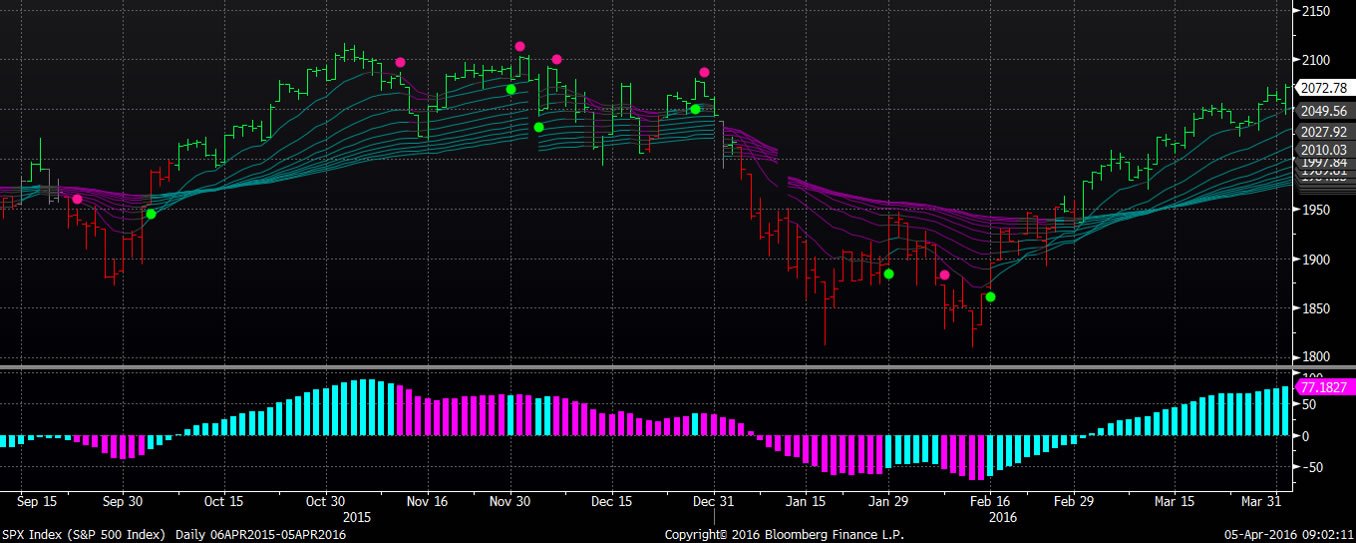
Green arrows: the signal of trend change (bullish or bearish)
Pink circle (possible exhaustion of the uptrend)
Olive green circle (possible exhaustion of the downtrend), can be used in two ways:
- As a profit-taking area (usually overnight position)
- As an alert zone where you can set the stop or trailing stop
The lime or red arrows serve as an indicator for the re-entry of positions and / or to confirm the trend.
OHLC bars, red (bearish), green (bullish), gray (neutral)


PLATFORMS
Available in:


BLOG
GTI Indicators news in the media

Bitcoin techniques suggest the monster rally went too far, too fast
Bitcoin’s trading around $9,000 once again but technical indicators show it may have gone up too far, too fast. Based…
» MORE INFORMATION

Bitcoin plummets in wake of Chinese New Year slowdown warning
Bitcoin traders appear to be heeding a warning of a demand slowdown ahead of China’s lunar New Year. The largest…
» MORE INFORMATION

Colombian launches application in Bloomberg
"The indicators are based on a developed theory of their own called the Relatively Adjusted Volatility Explosion (V.E.R.A.)". See News…
» MORE INFORMATION
As seen in: